
Wiser Machines
← All case studies Book a demo
CASE STUDY / SEMICONDUCTOR — DIE BONDING
11 of 13 failed wafer runs caught before the batch closed.

A single vibration sensor on an ASM AD210 Plus die bonding machine's LM guide detected 85% of confirmed pick-and-place failures — validated with leave-one-out cross-validation across 105 wafer runs.

85%
Detection recall — 11 of 13 failures, LOO-CV
0.732
AUC-ROC, leave-one-out cross-validated
247,372
Die placements analyzed, WW14 · DA#39
0.042%
Out-of-bounds placement rate
/ THE ASSET
ASM AD210 Plus die bonding machine

A high-throughput die bonding platform used in advanced semiconductor packaging, placing individual dies at speeds exceeding 10,000 units per hour. The LM (Linear Motion) guide governs the precise movement of the bond head — degradation here directly affects placement accuracy and increases the probability of failed picks.

BatchDA#39 · WW14, 27 Mar – 3 Apr 2025
Wafers processed126
Valid placements247,372
X / Y spec limits±10.0 μm / ±7.0 μm
Cpk X / Cpk Y1.361 / 1.455
Sentinel / failed wafers19 / 15
/ THE PROBLEM
Failures are discovered hours after they happen.

Failed picks are normally caught only at end-of-batch inspection — by then the wafer is committed and the root cause has cooled. Silent calibration drift is worse: one wafer drifted to +31.8 μm in X over 8 consecutive placements with no sentinel triggered at all.

Late discovery
Wafers scrapped after the full production cycle
No real-time signal
Cannot intervene mid-batch
Silent OOB drift
Out-of-spec dies pass inspection undetected
Root cause delay
Failure mode obscured by the time gap
Sensor bandwidth gap
Low-frequency sensors miss bearing signatures
/ THE SOLUTION
A single accelerometer on the LM guide rail.

Wiser's sensor mounts directly on the LM guide rail, capturing tri-axial acceleration once per pick-and-place cycle. The pipeline computes vibration energy, cycle timing, and frequency-domain features in real time — no human intervention required.

Sampling rate3.35 Hz — one sample per cycle
Key feature 1RMS tail energy — p99 breaches
Key feature 2Cycle CV — pick timing variance
Failed runs breach the threshold more often, and harder.

Failed runs show a mean tail-energy difference of +0.071 m/s² (p=0.024, Cohen's d=0.66) against clean runs — a real, statistically significant signal, not noise.
Failures detected11 of 13 (85% recall)
Failures missed2 — non-vibration root cause
False alarm rate38% at best-F1 threshold
AUC-ROC0.732 (LOO-CV, no data leakage)
03.1 — CASE EXAMPLE
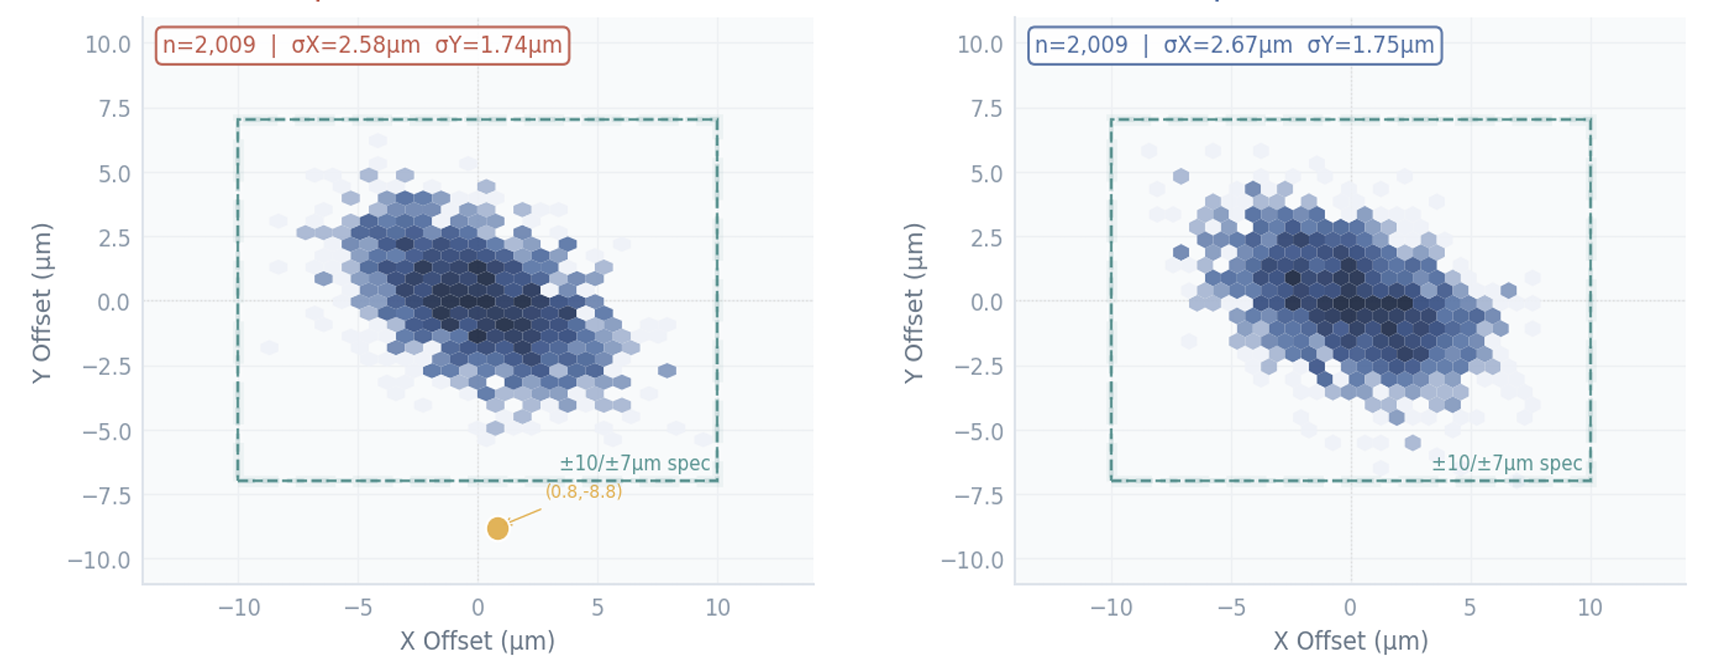
X–Y placement scatter — one out-of-bounds pick against a clean passing run.
X-Y placement scatter, out-of-bounds run vs passing run
FIG. 1 / Left: run with an out-of-bounds placement (0.8, -8.8 μm), caught by the LM guide vibration sensor. Right: passing run, all placements inside ±10/±7 μm spec.
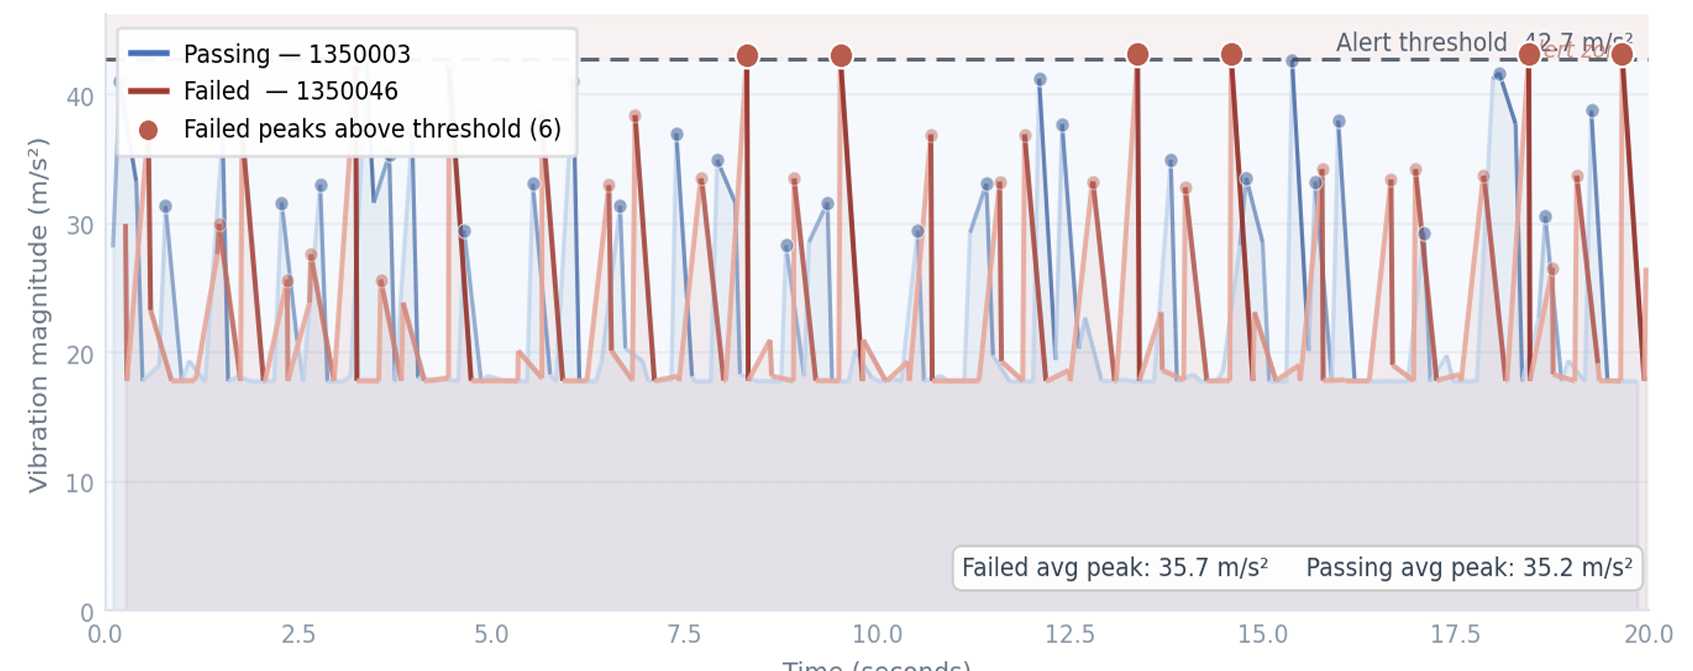
Worst failure in the batch — 6 threshold breaches in a 20-second window.
Raw vibration — 20-second window, passing run 1350003 vs failed run 1350046
FIG. 2 / Failed: 1350046 (2 sentinel, 0 OOB) vs Passing: 1350003. Red dots = peaks above 42.7 m/s² alert threshold.
/ THE CONCLUSION
A real signal — with a clear upgrade path to >0.95 AUC.

The two undetected failures were vacuum or vision faults — invisible to a vibration sensor by design. The 38% false-alarm rate is a consequence of the 3.35 Hz sampling bandwidth; a 10 kHz accelerometer on the same mount would unlock bearing and resonance frequencies and is expected to push AUC above 0.95.

Signal is real
AUC=0.732, p=0.024 → deploy model in production
Undetectable failures
Vacuum/vision root cause → add a vacuum pressure sensor
Best upgrade path
10 kHz accelerometer → expected AUC > 0.95
Run this on your own fab floor.
Book a demo
© 2026 Wiser Machines Inc.